PlantFarm Scan: Per-Tree Plant Health from Drone Imagery, Built with GETEK
Introduction
A walnut orchard has thousands of trees. Disease or water stress usually starts in a single tree, before the leaves turn yellow, and someone walking the orchard has almost no chance of spotting it early. Multispectral drone imagery solves half of the problem: it measures the plant's infrared response, which the eye cannot see. The other half is working out which tree is getting worse.
PlantFarm is GETEK's platform for tree-level traceability and field management. We built its PlantFarm Scan module together with GETEK: an AI application that takes a drone orthophoto, finds every tree, measures its health and follows it from flight to flight.
What It Does
The user uploads the GeoTIFF orthophoto from a flight. From there:
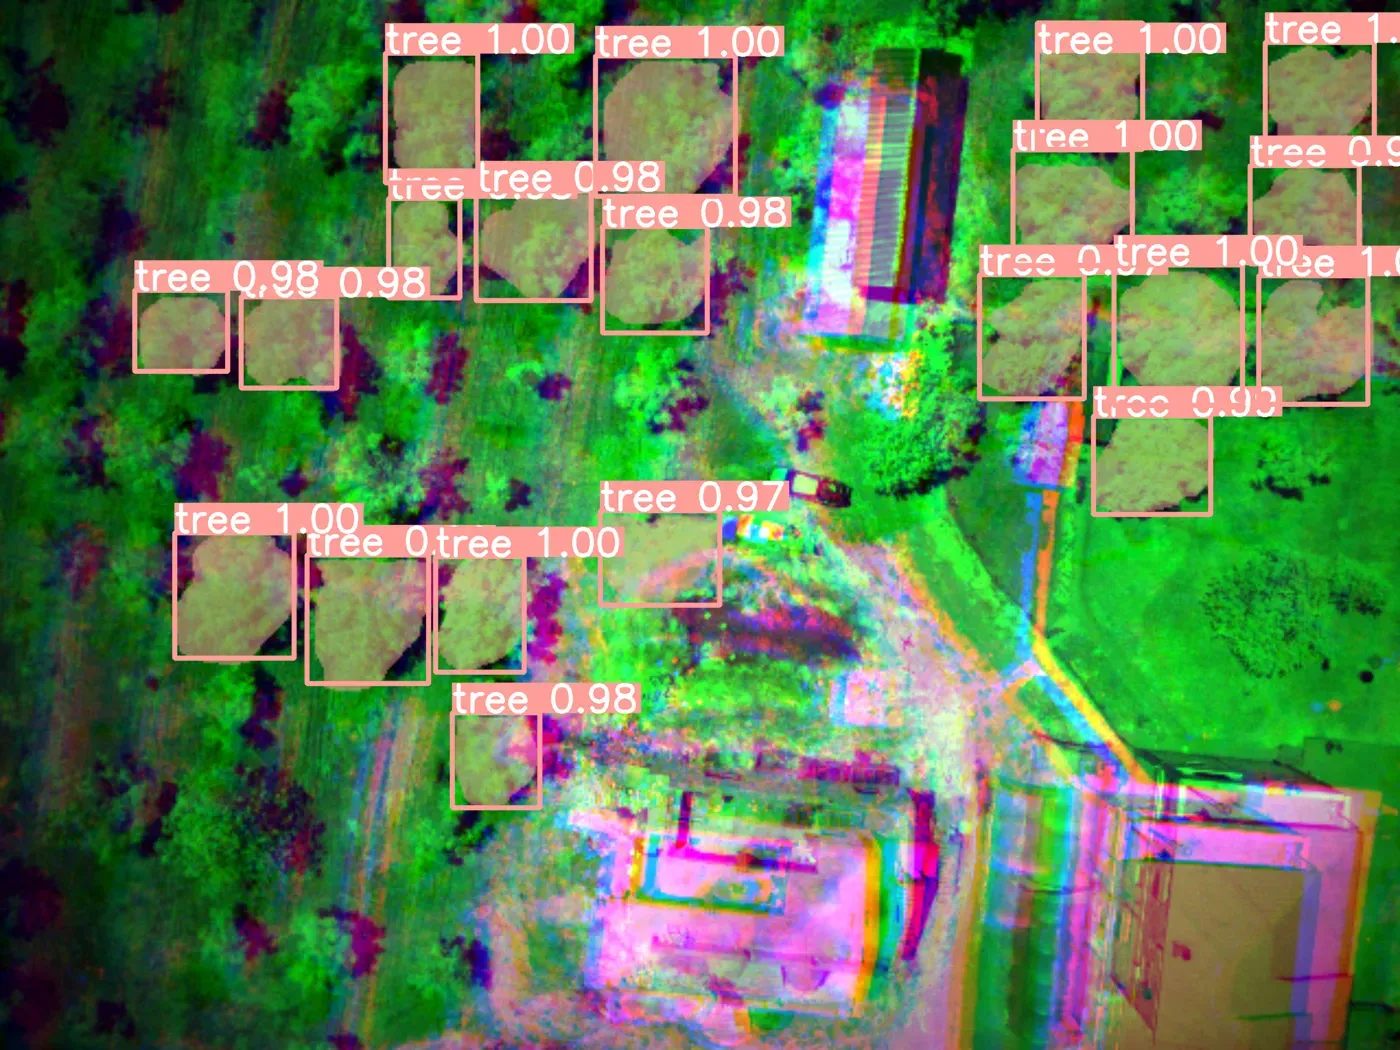
- Crown detection: our own deep learning model (Walnut AI) extracts the crown of every walnut and almond tree at pixel level.
- Per-tree measurement: vegetation indices such as NDVI, NDRE and GCI are computed over the pixels inside each crown. The measurement uses the actual crown mask, not the bounding box, so soil and grass between trees do not skew the average.
- Persistent tree ID: the same tree gets the same ID across flights on different dates, using location-based matching.
- Trends: each tree's index values become a time series, flight by flight. Rising, falling and stable trees are counted across the project and the worst performers are listed.
- Reports: PDF, Excel or CSV reports for an area drawn on the map and the selected flights.
On top of that there is ground classification (soil, dry grass, green grass, healthy tree, stressed tree, shadow) and a relative vigour measure that compares each tree with its own surroundings. Land-registry parcel boundaries can also be queried on the map.
Why an Off-the-Shelf Approach Was Not Enough
The first version separated trees by NDVI thresholding (Otsu's method): green is tree, everything else is not. That broke on the first real flight, where grass and weeds were green too. Touching crowns came out as one blob and patches of grass were counted as trees.
So we treated tree detection as an instance segmentation problem and trained the model on our own flight images. We describe how the model was trained, which frames we picked and what we learned in a separate post.
There Is an Assistant, Too
Numbers alone do not make a decision; someone has to ask "this tree's NDRE has dropped for three flights, what could it be?". The AI Operator in PlantFarm Scan answers that question by reading the project's own measurements together with walnut disease literature. It runs in-house on a local language model. Details are in our RAG agronomy assistant post.
Technology
| Layer | What we use |
|---|---|
| Image processing | Rasterio, NumPy, OpenCV, Shapely, Cloud Optimized GeoTIFF |
| AI | YOLOv8-seg (custom-trained), Ollama, bge-m3 embeddings |
| Backend | Python, FastAPI, SQLAlchemy |
| Frontend | React, TypeScript, Leaflet |
| Deployment | Docker, NVIDIA GPU |
Map tiles are not pre-rendered; each zoom renders the requested index and colour scale on the fly, so switching from NDVI to NDRE does not mean waiting for a new job.
Conclusion
PlantFarm Scan is our first large project that takes machine learning from a demo to a tool that runs on every flight. We call this approach Industrial AI: a model trained on your data, measured on sites it never saw in training, then shipped as an application used every day. We are taking the same approach beyond agriculture, from map drafting to production lines.
If you have a similar need, see our Industrial AI solution or get in touch.